




Digbi HealthOutcomes and savings · Case study
Editorial cover image for the Rigid packaging manufacturing case study

Rigid packaging manufacturing · California · Live since January 2024

Cutting the high risk IBS segment by 42% with a California packaging manufacturer

42%

fewer members in the high risk IBS segment

218

members enrolled, 5.8% utilization

78-98%

cohort engagement (avg. 80%) held across every quarter

$1,731

validated annual savings per enrolled member

~4,000 covered livesConsultant · Gallagher (AJG)Through the November 2025 outcomes report33 pages
Digbi HealthPackaging manufacturer · Through the November 2025 outcomes report

02 · Impact summary

Delivering health outcomes
and financial savings.

Digbi took a shift based packaging workforce with untreated digestive and metabolic disease, ran genetic and gut testing to set each care plan, and moved 42% of the high risk IBS segment out of that segment while carrying eligibility, launch and member outreach for a two person benefits team.

What Digbi has delivered on this account

42%

reduction in the high risk IBS segment

28%

growth in members with mild or no digestive symptoms

33%

reduction in the moderate IBS segment

218

members enrolled as of November 2025

5.8%

utilization of the eligible population

7.7 → 5.8

population average A1C, August 2025 report

92%

of members would recommend the program

$1,731

validated annual savings per enrolled member

Impact summary02
Digbi HealthPackaging manufacturer · Through the November 2025 outcomes report

03 · Contents

What is inside
this case study.

Every page carries its own figures and source, from the covered population through outcomes, member voice and savings delivered for packaging manufacturer.

Pages

  1. Market certaintyPage 04
  2. Client snapshotPage 05
  3. Scientific certaintyPage 06
  4. The challengePage 07
  5. Why DigbiPage 08
  6. Clinical certaintyPage 09
  7. Risk concentrationPage 10
  8. Health outcomesPage 11
  9. IBS outcomes dashboardPage 12
  10. Behaviour changePage 13
  11. Operational certaintyPage 14
  12. The programPage 15
  13. Utilization and outreachPage 16
  14. Enrollment in detailPage 17
  15. Product certaintyPage 18
  16. Member satisfactionPage 19
  17. Member testimonialsPage 20
  18. Financial certaintyPage 21
  19. Claims and cost concentrationPage 22
  20. Claims trend by plan yearPage 23
  21. Claim spend by conditionPage 24
  22. Key figuresPage 25
  23. Performance guaranteesPage 26
  24. Brand certaintyPage 27
  25. Book of businessPage 28
  26. Future certaintyPage 29
  27. Looking aheadPage 30
  28. Decision supportPage 31
  29. Request the full studyPage 32
  30. Sources and definitionsPage 33
Contents03
Digbi HealthPackaging manufacturer · Through the November 2025 outcomes report

04 · Certainty module 01

Market certainty
Organizations like this one have already validated Digbi at scale

A rigid packaging manufacturer covering roughly 4,000 lives across California plants has run the program since January 2024, placed by Gallagher.

What the next pages prove

  • 01Two plan years live across a multi site manufacturing footprint
  • 02Consultant of record: Gallagher (AJG)
  • 03Coverage extends to spouses and adult dependents, not employees alone

Pages in this module

  1. Client snapshot
Certainty module 0104
Digbi HealthPackaging manufacturer · Through the November 2025 outcomes report

05 · Client snapshot

A gut health program built for
a production workforce.

A gut health first program built for a manufacturing workforce, where eligibility starts from digestive conditions rather than body weight.

At a glance

Industry
Rigid packaging manufacturing
Headquarters
California
Population
~4,000 covered lives
Kickoff to go live
September 2023 to January 2024
Program launch
January 2024
Program focus
Digestive and metabolic health
Consultant of record
Gallagher (AJG)

The covered workforce

~4,000

covered lives, including spouses and adult dependents

218

members enrolled, 5.8% of the eligible pool

57 / 43

women to men among enrolled members

78 / 22

employees to dependents among enrolled members

10%

enrollment target set for the 2026 plan year

0

on site clinics, so enrollment happens on a phone

Roughly four thousand covered lives sit across rigid packaging plants in California. Most are hourly production workers on rotating shifts, and coverage extends past employees to spouses and adult dependents, so the population Digbi has to reach is a family group rather than a headcount.

This is a classic blue collar benefits problem. There is no on site clinic, no desk, and no natural moment in the working day when a member can sit down and enroll in something. Everything has to happen on a personal phone, on the member's own time, and it has to be worth the effort the first time it is offered.

A rigid packaging manufacturing employee at work in California

Population mix

Gender split

57:43

Dependents enrolled

22%

Utilization

5.8%

2026 utilization target

10%

Client snapshot05
Digbi HealthPackaging manufacturer · Through the November 2025 outcomes report

06 · Certainty module 02

Scientific certainty
The approach is backed by measurable clinical outcomes

Eligibility starts from digestive disease rather than body weight, with gut microbiome and genetic testing directing the care plan for each member.

What the next pages prove

  • 01Gut health first eligibility, built on microbiome and DNA testing
  • 02Digestive, inflammatory and cardiometabolic conditions addressed together

Pages in this module

  1. The challenge
  2. Why Digbi
Certainty module 0206
Digbi HealthPackaging manufacturer · Through the November 2025 outcomes report

07 · The challenge

Adoption on the plant floor,
not eligibility.

Digbi members preparing a fresh meal at home

Where the pressure comes from

01

Getting a shift based, blue collar workforce to adopt a health benefit at all. There is no on site clinic and no desk moment, so every sign up has to be won on a personal phone.

02

Lifting utilization past the level most point solutions settle at. Enrollment reached 5.8% of covered lives by November 2025 against a 10% target for 2026.

03

Holding members past the first month. Adoption only matters if engagement survives rotating shifts, overtime and family demands.

04

Moving real clinical numbers, not activity scores. Digestive disease, A1C and medication burden had to come down for the program to earn renewal.

05

Reaching the men on the plant floor, who enroll at a lower rate than women and carry a heavy share of the untreated cardiometabolic risk.

06

Doing all of it without adding work for a two person benefits team, which meant Digbi had to own eligibility, launch communications and ongoing outreach.

The challenge07
Digbi HealthPackaging manufacturer · Through the November 2025 outcomes report

08 · Why Digbi

Precision biology aimed
at the gut.

The program is built around individual gut, genetic and glucose data, and carries no cost to eligible members.

The differentiators the client cites

01

Gut first precision biology

A model built around gut microbiome, genetics and continuous glucose data, aimed directly at GI conditions rather than generic weight loss.

02

One program, three cost categories

Obesity, cardiometabolic disease and GI are covered together, in place of a stack of single purpose point solutions.

03

Fast, managed launch

A four month runway from September 2023 kickoff to January 2024 go live, with monthly reviews for the first quarter and quarterly account reviews after that.

04

No cost to members

The program carries no cost to eligible members, which removes the main barrier for hourly and shift based workers.

05

Coaching members rate highly

Coaching quality is a measured strength, with a 4.7 out of 5 coach relationship rating in the November 2025 report.

GI first design

Eligibility, coaching and reporting are all organised around digestive conditions.

Coach relationship

Rated 4.7 out of 5 by members in the November 2025 report.

No cost to members

Open to eligible employees and dependents with no program fee.

Why Digbi08
Digbi HealthPackaging manufacturer · Through the November 2025 outcomes report

09 · Certainty module 03

Clinical certainty
Members are supported by a safe, accountable clinical model

Symptom severity is graded member by member each quarter, so movement out of the high risk segment is visible in the outcomes report.

What the next pages prove

  • 01High risk IBS segment down 42%
  • 02Mild or symptom free group up 28%
  • 03Nutrient density carried past the clinical threshold

Pages in this module

  1. Risk concentration
  2. Health outcomes
  3. IBS outcomes dashboard
  4. Behaviour change
Certainty module 0309
Digbi HealthPackaging manufacturer · Through the November 2025 outcomes report

10 · Risk concentration

Where the high risk
members moved.

The IBS dashboard tracks members across severity bands. Through Q4 2025 the high risk band shrank while the mild or no symptom band grew.

Named eligibility conditions

IBS, K58

Named eligibility condition

GERD and reflux, K21

Named eligibility condition

Functional dyspepsia and gastritis, K30 and K29

Named eligibility condition

NAFLD, K76.0

Named eligibility condition

Pancreatitis, K85 and K86

Named eligibility condition

Constipation and motility, K59

Named eligibility condition

42%

High risk band down

33%

Moderate band down

28%

Mild or none up

Source · Quarterly outcomes and impact report, November 2025, through Q4 2025

A Digbi member at home reviewing program results over a meal
Risk concentration10
Digbi HealthPackaging manufacturer · Through the November 2025 outcomes report

11 · Health outcomes

Clinical movement
and validated savings.

Clinical, satisfaction and savings outcomes are all computed in the quarterly report and reported to the client against a matched baseline.

Outcome status

Measured

IBS risk migration

High risk and severe segment down 42%, moderate segment down 33%, and mild or no symptom members up 28%, measured through Q4 2025.

Measured

Nutrient density

Score moved from 11.6 to 12.5 during 2025, crossing the 12 plus range linked in the report to sustained weight loss and gut health improvement.

Measured

Metabolic markers

Population average A1C improved from 7.7 to 5.8 and Metformin use fell 75% across the same reporting period, per the August 2025 report.

Measured

Performance guarantees

Health outcomes guarantee met against a 20% improvement target, the cost guarantee met at $1,731 saved per member, and the satisfaction guarantee met with 92% of members recommending the program.

Measured

Cost reduction

Validated savings of $1,731 per enrolled member per year, driven by lower digestive and cardiometabolic utilization across the enrolled group.

Health outcomes11
Digbi HealthPackaging manufacturer · Through the November 2025 outcomes report

12 · IBS outcomes dashboard

Members moving out of
the high risk band.

Every enrolled member is scored into a symptom band each quarter. Between Q1 2024 and Q4 2025 the severe band collapsed and the mild or no symptom band absorbed most of that movement.

Share of members by symptom band, Q1 2024 to Q4 2025

Q1 24

Q2 24

Q3 24

Q4 24

Q1 25

Q2 25

Q3 25

Q4 25

No or minimal symptomsMild symptomsModerate symptomsSevere symptoms

-42%

High risk IBS segment

A steady shift out of severe symptoms, lowering GI claim exposure.

+28%

Mild or no symptom members

Improved gut balance and sustained adherence through Q4 2025.

-33%

Moderate IBS segment

Fewer members left in the moderate range, preventing flare escalation.

Source · Quarterly outcomes and impact report, November 2025, IBS outcomes dashboard, share of members by band

IBS outcomes dashboard12
Digbi HealthPackaging manufacturer · Through the November 2025 outcomes report

13 · Behaviour change

Sustained change
in food choices.

Nutrient density scores track what members actually eat. Scores climbed through 2025 and held above the clinical threshold, which the report reads as lasting behaviour change rather than short term diet fatigue.

Nutrient density score trend

Clinical threshold 1210.712.212.011.712.212.312.412.5
Q1 24Q2 24Q3 24Q4 24Q1 25Q2 25Q3 25Q4 25

The clinical threshold of 12 and above is associated with sustained weight loss and gut health improvement

+7%

Nutrient density score

Scores climbed from 11.6 to 12.5 across 2025, past the clinical threshold.

+9%

Member retention year over year

Renewed participation and steady coaching show behaviour change is lasting.

-15%

Quarterly variability

Smoother quarter to quarter trends make population health easier to forecast.

Source · Quarterly outcomes and impact report, November 2025, quarterly nutrient density score

Behaviour change13
Digbi HealthPackaging manufacturer · Through the November 2025 outcomes report

14 · Certainty module 04

Operational certainty
The program has been implemented successfully across a dispersed workforce

Hourly production workers on rotating shifts, no on site clinic and no desk. Enrollment had to work on a personal phone the first time it was offered.

What the next pages prove

  • 01218 members enrolled, 5.8% of the eligible pool
  • 02Kickoff to go live in four months, September 2023 to January 2024
  • 03Enrollment sustained quarter over quarter since launch

Pages in this module

  1. The program
  2. Utilization and outreach
  3. Enrollment in detail
Certainty module 0414
Digbi HealthPackaging manufacturer · Through the November 2025 outcomes report

15 · The program

What members
actually receive.

Members qualify through claims or a GI screening, then work with a coach against their own gut, gene and glucose data.

Member journey

  • 01Eligibility screening, either claims based or through the GI symptom screener
  • 02App orientation, intake form, then at home DNA, gut microbiome and continuous glucose kits shipped to the member
  • 03Personalised genetics, gut, nutrition and fitness reports that identify individual triggers
  • 04Meal logging with real time nutrient density scoring, plus barcode scanning for guidance in the aisle
  • 05One to one coaching, with dietary and supplement changes tied to the reports
  • 06Ask Digbi, a 24/7 AI coaching layer added in Q1 2025 between coach sessions
  • 07Milestone based year two renewal, on either a preventive or a full scope tier
  • 082026 roadmap adds group coaching by condition, women's health tracks and dependent outreach
A Digbi member opening her DNA and gut test kit at home

Every member begins with a gut and genetic test, shipped to the door

The program15
Digbi HealthPackaging manufacturer · Through the November 2025 outcomes report

16 · Utilization and outreach

Who enrolled,
and when.

Digbi runs the outreach calendar, not the benefits team. Launch communications drove the Q1 2024 spike, and a second targeted campaign restarted enrollment through 2025.

Gender distribution

Women125 · 57%
Men93 · 43%

Employee and dependent split

Employees170 · 78%
Dependents48 · 22%

Half-yearly enrollment · 218 total enrollments

97

H1 2024

12

H2 2024

79

H1 2025

30

H2 2025

Half-yearly utilization of covered lives

2.6%

H1 2024

2.9%

H2 2024

5%

H1 2025

5.8%

H2 2025

Utilization is cumulative enrollment as a share of the 3,750 eligible covered lives at each half year end. The contracted target for the 2026 plan year is 10%.

Source · Quarterly outcomes and impact report, November 2025, enrollment status as of 11 November

Utilization and outreach16
Digbi HealthPackaging manufacturer · Through the November 2025 outcomes report

17 · Enrollment in detail

Month by month,
how the roster was built.

A direct pull from the member platform gives a month by month view of how this population signed up, how the two open enrollment pushes landed, and how many members stayed on the roster.

New enrollments by month

30

33

16

6

8

4

2

2

5

1

2

1

1

46

9

6

17

7

3

13

2

8

7

2

2

4

15

4

17

1

Jan 24Mar 24May 24Jul 24Sep 24Nov 24Jan 25Mar 25May 25Jul 25Sep 25Nov 25Jan 26Mar 26May 26Jul 26

New enrollments by plan year

109

2024

120

2025

45

2026 ytd

Roster at a glance

277

member records ever enrolled since launch

244

members currently on enrolled status

187 / 49

employees to dependents among classified records

46

new members in March 2025, the largest single month

45

new members in 2026 through August, a partial year

Launch month carried the program. January and February 2024 delivered 63 of the first year's 109 sign ups, which is what a well run open enrollment push looks like in a plant population.

March 2025 produced 46 new members in a single month, the largest jump on record, and a second wave followed in the summer of 2026 with 36 sign ups across May, June and July.

The platform count tracks the account reviews closely. Cumulative sign ups land within two members of the 80, 158 and 228 figures reported to the client at each checkpoint.

Source · Digbi member platform export, covered population records, January 2024 through August 2026.

Enrollment in detail17
Digbi HealthPackaging manufacturer · Through the November 2025 outcomes report

18 · Certainty module 05

Product certainty
Members engage and sustain participation over time

Participation holds across plan years, and members describe the change in their own words rather than through a survey score.

What the next pages prove

  • 01Members stay enrolled across plan years, not weeks
  • 02Recorded member stories from the plant floor

Pages in this module

  1. Member satisfaction
  2. Member testimonials
Certainty module 0518
Digbi HealthPackaging manufacturer · Through the November 2025 outcomes report

19 · Member satisfaction

What members say
about the program.

Satisfaction is surveyed every quarter and reported alongside the clinical outcomes, because retention is what keeps the behaviour change going.

92%

Recommendation rate

Members who would recommend the program to a colleague or family member.

$1,731

Annual savings per member

Validated savings per enrolled member against the matched baseline.

4.7 / 5

Coach relationship rating

Members rate the coaching relationship as excellent.

Coach relationship quality

Members cite the expertise, empathy and responsiveness of their dedicated coach.

Visible, tangible results

Members report understanding their triggers and seeing symptom improvement they can feel.

App usability

Meal and symptom logging is the habit that makes the trigger reporting click.

“The personalised approach made all the difference. My coach did not just give me generic advice, she helped me understand my body and make changes that actually work for my lifestyle.”

“The coaches answer my questions and offer meal ideas. I have more energy, no bloating, and I have kept a healthy weight.”

Member satisfaction19
Digbi HealthPackaging manufacturer · Through the November 2025 outcomes report

20 · Member testimonials

Stories from the
Humans of Digbi.

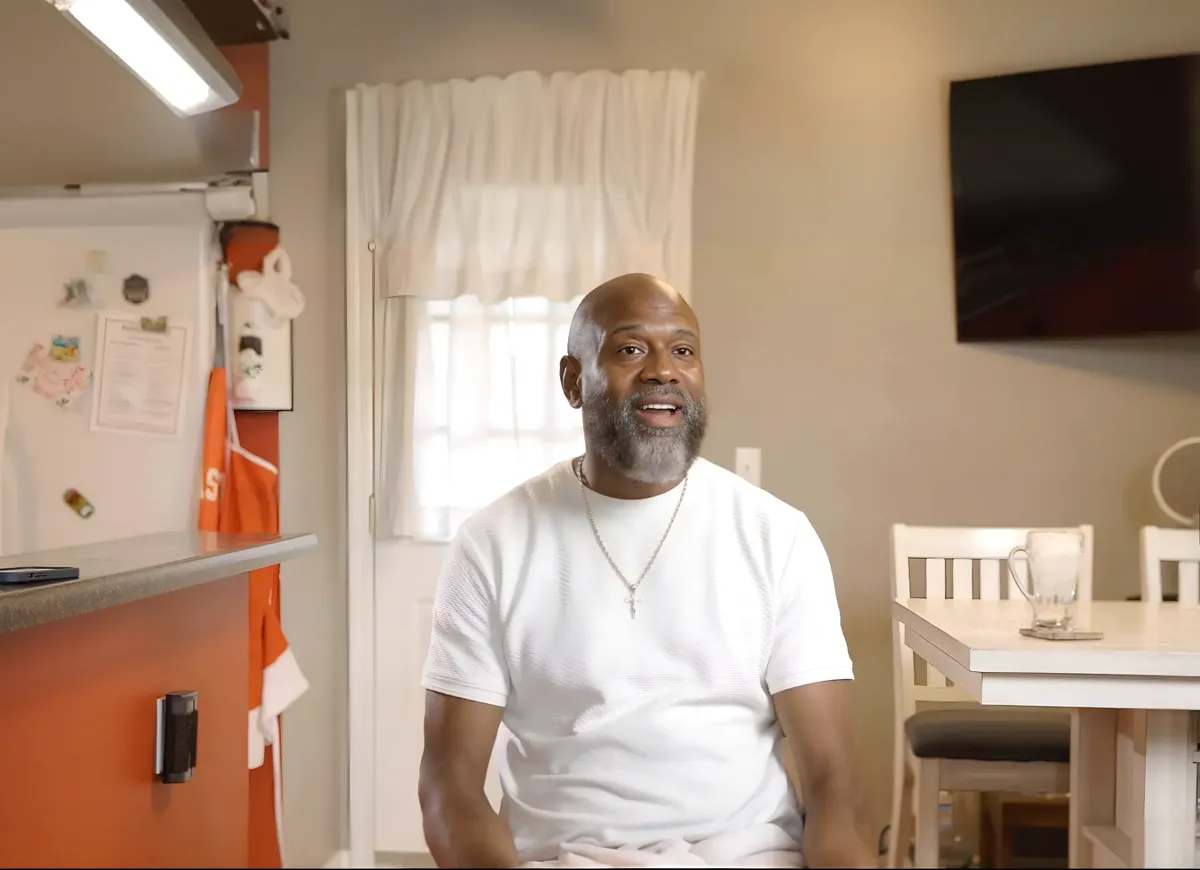
Alton, a program participant

Alton

Production workforce, age 52 · Missouri

Watch the video

“I joined because of acid reflux and high cholesterol. I wanted to understand how to control it, not just live with it.”

Getting my gut health and my DNA results back made me understand things in much more depth. I found out I was lactose intolerant, and I made adjustments from there.

My gut is not fighting me anymore. I sleep better, I concentrate better, and I have far less pain in my joints and my back.

I tell coworkers about it every day. It is free to us as employees, so take advantage of it, because it does make a difference in your life.

22 lb

Weight lost

Acid reflux resolvedGut triggers identifiedLactose intolerance foundA1C improved

Hyland, a program participant

Hyland

Production workforce, age 66 · Illinois

Watch the video

“They run a couple of tests and send you a health report. It tells you which gut bug is low and what to eat to bring it back up.”

That is a test you would never get from a normal doctor. I certainly had never had one done.

The quick start plan listed foods to eat and foods to avoid, and I log it all through the app. I learned that flour and white bread were the real problem for me, and the glucose monitor showed me what potatoes were doing to my blood sugar.

People at work asked what I was doing differently, and they have signed up through the company too.

32 lb

Weight lost

Severe IBS reversedGluten sensitivity foundMetformin reducedA1C improved
Member testimonials20
Digbi HealthPackaging manufacturer · Through the November 2025 outcomes report

21 · Certainty module 06

Financial certainty
The program delivers measurable business value

Spend is read from the claims file: where it concentrates, how it trends and which conditions carry it, with fees at risk against contracted guarantees.

What the next pages prove

  • 01Both contractual performance guarantees met
  • 02High cost claimant concentration reported per plan year
  • 03Condition level spend mapped to the program's clinical focus

Pages in this module

  1. Claims and cost concentration
  2. Claims trend by plan year
  3. Claim spend by condition
  4. Key figures
  5. Performance guarantees
Certainty module 0621
Digbi HealthPackaging manufacturer · Through the November 2025 outcomes report

22 · Claims and cost concentration

Where the claim dollars
actually sit.

Claims records were pulled member by member for the covered population and summed by plan year. The picture is the one most self funded employers recognise. A small group of high cost claimants carries almost all of the spend.

$2.46M

total claim cost across all plan years on file

1,267

members with claim cost recorded

213

high cost claimants at the $2,000 threshold

81.9%

of all claim spend sits with those 213 members

Members by lifetime claim cost

Under $2,0001053 · 83%
$2,000 to $10,000162 · 13%
$10,000 to $50,00046 · 4%
$50,000 and above5 · 0%

Lifetime claim cost per member, all plan years summed. Just over eight in ten members stay under the high cost threshold, and the 51 members above $10,000 are where a targeted program earns its return.

16.8%

of claimants are high cost

81.9%

of dollars they account for

4.9x

spend concentration versus their share of members

Source · Digbi claims pull, covered population, plan years 2022 through 2025. High cost claimant defined as $2,000 or more in claims, the Digbi standard threshold.

Claims and cost concentration22
Digbi HealthPackaging manufacturer · Through the November 2025 outcomes report

23 · Claims trend by plan year

Cost per member,
before and after launch.

Claim cost per member per year for the whole claims population, shown next to the same population with high cost claimants removed.

Cost per member per year

2025 against the 2023 baseline

32.9%

$1,013

$265

$1,584

$331

$1,173

$321

$1,062

$343

2022

2023

2024

2025

All claimantsExcluding high cost claimants

Cost per member per year fell in both plan years after the January 2024 launch, from $1,584 in 2023 to $1,062 in 2025. Strip the high cost claimants out and the rest of the population barely moves, holding between $265 and $343 across four years. The trend line for this employer is the high cost cohort.

High cost claimants, share of members against share of spend

6.2%

73.6%

10.5%

80.1%

12.3%

74.4%

9.9%

70.2%

2022

2023

2024

2025

Share of claimantsShare of claim spend

The share of claimants crossing the $2,000 threshold rose through 2024 and eased back in 2025. Their share of total spend has stayed in the seventy to eighty percent band every single year, which makes this cohort the only place a savings plan can move the number.

Source · Digbi claims pull, covered population, plan years 2022 through 2025. High cost claimant defined as $2,000 or more in claims, the Digbi standard threshold.

Claims trend by plan year23
Digbi HealthPackaging manufacturer · Through the November 2025 outcomes report

24 · Claim spend by condition

Which conditions carry
the cost.

Claim cost ranked by the conditions carried by the members generating it, with the number of members behind each line.

Claim cost by condition, all plan years

Gastrointestinal, K00 to K95$1.15M335
Gastroesophageal reflux, K21$613k196
Functional GI disorders, K58 and K30$469k121
Motility and constipation, K59$382k80
Hypertension, I10$1.19M592
Diabetes, E11$1.02M324
Metabolic disorders, E88$900k385
Hyperlipidemia, E78$708k361
Coronary artery disease, I25$191k63
Mental health, F30 to F48$179k102

Claim cost · members

Digestive codes are listed first because eligibility, coaching and reporting for this account all start there. Taken together, the GI codes carry $2.6M of claim value across the covered population, more than any single cardiometabolic code. Each member's full claim cost is counted against every condition they carry, so these totals overlap rather than add up.

5.6%

high cost claimant rate among enrolled members in 2025

10.0%

high cost claimant rate among members who never enrolled

$1,731

average annual savings per enrolled member

Enrolled members crossed the high cost threshold at roughly half the rate of the members who never signed up. The enrolled group with 2025 claims on file is still small, so this reads as a strong early signal that widens as utilization climbs toward the 10% target.

Source · Digbi claims pull, covered population, plan years 2022 through 2025. High cost claimant defined as $2,000 or more in claims, the Digbi standard threshold.

Claim spend by condition24
Digbi HealthPackaging manufacturer · Through the November 2025 outcomes report

25 · Key figures

GI outcomes, savings,
and population health.

42%

reduction in the high risk and severe IBS segment

Through Q4 2025 · Quarterly outcomes and impact report, November 2025

28%

growth in members reporting mild or no digestive symptoms

Through Q4 2025 · Quarterly outcomes and impact report, November 2025

$1,731

validated annual savings per enrolled member

Through Q4 2025 · Quarterly outcomes and impact report, November 2025

7.7 → 5.8

population average A1C, with Metformin use down 75%

Through August 2025 · Outcomes and impact report, August 2025

98 → 218

cumulative enrollment, more than doubling within a year

Mid 2024 through November 2025 · Quarterly outcomes and impact report, November 2025

78-98% · avg. 80%

engagement range held by every enrollment cohort measured, averaged across all reported cohort-quarters

2024 Q1 cohort through 2025 Q3 cohort · Quarterly outcomes and impact report, November 2025

92%

of surveyed members would recommend the program

Through Q4 2025 · Quarterly outcomes and impact report, November 2025

11.6 → 12.5

nutrient density score, a 15% year over year gain

Calendar year 2025 · Quarterly outcomes and impact report, November 2025

4.7 / 5

member rating of the coach relationship

Through Q4 2025 · Quarterly outcomes and impact report, November 2025

Savings are measured per enrolled member per year against a matched baseline and reported alongside the clinical outcomes each quarter.

Key figures25
Digbi HealthPackaging manufacturer · Through the November 2025 outcomes report

26 · Performance guarantees

Fees at risk,
measured against target.

The contract puts fees at risk against health outcomes, cost and satisfaction. Two guarantees are met outright and the third is tracking to full claims validation.

Status against contractual targets

CategoryContractual targetStatusCurrent performance
Health outcomes20% or better improvement in at least one condition metricMetIBS high risk segment down 42%, nutrient density up 7%
Cost reductionReduction in controllable GI related spendMetValidated savings of $1,731 per enrolled member per year
Employee satisfactionMajority of surveyed members recommend the programMet92% of members would recommend, coach rating 4.7 out of 5

Health outcomes exceeded

All clinical metrics sit above the 20% threshold, with IBS outcomes in the top quartile of the Digbi book.

Cost reduction met

Validated savings of $1,731 per enrolled member per year, driven by lower GI and cardiometabolic utilization.

Satisfaction exceeded

92% of members would recommend the program, and members rate the coach relationship 4.7 out of 5.

Performance guarantees26
Digbi HealthPackaging manufacturer · Through the November 2025 outcomes report

27 · Certainty module 07

Brand certainty
Digbi is built for long-term partnership

The same model runs across pipeline, public sector and professional services books of business.

What the next pages prove

  • 01A book of business, not a single account

Pages in this module

  1. Book of business
Certainty module 0727
Digbi HealthPackaging manufacturer · Through the November 2025 outcomes report

28 · Book of business

What Digbi has delivered
for comparable employers.

Context from other Digbi employer clients, not this client. Shown so a reader can see where a mature program tends to land.

Claims cost per enrolled member

Savings over four years

$18,500/member

$9,320

$9,320

$7,035

$10,465

$6,310

$12,497

$5,403

$14,576

2021

2022

2023

2024

On DigbiNot on Digbi

Over four years the claims cost per enrolled member fell from $9,320 to $5,403, while the matched group that never enrolled rose to $14,576. The gap covers diabetes, metabolic syndrome, digestive conditions and GLP-1 medication spend.

42%

Reduction in claims cost per enrolled member over four years

11.6 lbs

Average weight loss at six months, blue collar employer cohort

74%

Of engaged members reduced blood pressure, blue collar employer cohort

Source · Digbi Health multi employer claims analysis 2021 to 2024, and the national food distributor case study, 2023. Other clients, not this one.

Book of business28
Digbi HealthPackaging manufacturer · Through the November 2025 outcomes report

29 · Certainty module 08

Future certainty
Digbi continues to expand value for the population

A 10% enrollment target for 2026, family focused open enrollment messaging and added medication support for the next plan year.

What the next pages prove

  • 0110% enrollment target set for the 2026 plan year

Pages in this module

  1. Looking ahead
Certainty module 0829
Digbi HealthPackaging manufacturer · Through the November 2025 outcomes report

30 · Looking ahead

The plan for
the next plan year.

The 2026 plan, agreed with the benefits team and the consultant, is written around reach rather than around clinical redesign.

2026 priorities

01

Take utilization to 10%

From 5.8% of the eligible population, through targeted communications and executive sponsorship.

02

Lift male enrollment

Male focused messaging and testimonials from current male participants on the plant floor.

03

Cut moderate and severe GI cases further

GI improvement correlates with better PHQ-8 and GAD-7 scores, so mood and energy move with it.

04

Extend to dependents and women's health

Family outreach, group coaching by condition, and tracks for PCOS, perimenopause and menopause.

Looking ahead30
Digbi HealthPackaging manufacturer · Through the November 2025 outcomes report

31 · Certainty module 09

Decision support
The internal team has everything needed to build a clear, defensible case for Digbi

Everything needed to carry this internally: the underlying figures, their sources and a route to the full study.

What the next pages prove

  • 01Every figure carries a named source

Pages in this module

  1. Request the full study
  2. Sources and definitions
Certainty module 0931
Digbi HealthPackaging manufacturer · Through the November 2025 outcomes report

32 · Request the full study

Want the full data pack
and the savings model?

Share your details and the Digbi team will send the complete study, including the underlying analysis and the enrollment model.

Or reach us directly

partner@digbihealth.com

digbihealth.com/meet

Request the full study32
Digbi HealthPackaging manufacturer · Through the November 2025 outcomes report

33 · Sources and definitions

Where each figure
comes from.

  1. 01

    Outcomes, engagement and satisfaction figures: quarterly outcomes and impact report, November 2025, Digbi Health internal. Earlier May 2025 and August 2025 versions are on file.

  2. 02

    Enrollment figures: 2025 enrollment data sheet, cross checked against the November 2025 report.

  3. 03

    Testimonials: recorded member videos and the member testimonial log, January 2026.

  4. 04

    Cost savings: validated savings of $1,731 per enrolled member per year, measured against a matched baseline in the November 2025 report.

Sources and definitions33

Talk to the team

Have questions? Our Enterprise team wants to hear from you.

Whether you are evaluating a precision nutrition program for a covered population or want to understand the methodology behind these case studies, we are happy to walk through it.