




Digbi HealthOutcomes and savings · Case study
Editorial cover image for the Public sector employee benefits trust case study

Public sector employee benefits trust · North Dakota · Live since May 2024

Sustaining 88% engagement across five quarters with a North Dakota health trust

88%+

engagement held for five consecutive quarters

84 → 449

participants, Q1 2024 to Q2 2025

74%+

of active members lost weight

12.2

nutrient density score, up from 10.5

~10,000 covered employeesConsultant · Brown & BrownThrough the May 2025 outcomes report31 pages
Digbi HealthPublic sector health trust · Through the May 2025 outcomes report

02 · Impact summary

Delivering health outcomes
and financial savings.

Population, comorbidity burden, behaviour change, engagement, clinical outcomes and member voice for a statewide public sector trust.

What Digbi has delivered on this account

449

participants as of Q2 2025

88%+

engagement across five straight quarters

74%+

of active members lost weight

35%

past the 5% clinically significant threshold

83%

of members on GLP-1 medication lost weight

72% / 8.5%

email open and click rates in 2025

Impact summary02
Digbi HealthPublic sector health trust · Through the May 2025 outcomes report

03 · Contents

What is inside
this case study.

Every page carries its own figures and source, from the covered population through outcomes, member voice and savings delivered for public sector health trust.

Pages

  1. Market certaintyPage 04
  2. Client snapshotPage 05
  3. Scientific certaintyPage 06
  4. The challengePage 07
  5. Why DigbiPage 08
  6. Clinical certaintyPage 09
  7. Risk concentrationPage 10
  8. Health outcomesPage 11
  9. Behaviour changePage 12
  10. Operational certaintyPage 13
  11. The programPage 14
  12. Participation curvePage 15
  13. Enrollment in detailPage 16
  14. Product certaintyPage 17
  15. Member satisfactionPage 18
  16. Member testimonialsPage 19
  17. Financial certaintyPage 20
  18. Claims and cost concentrationPage 21
  19. Claims trend by plan yearPage 22
  20. Claim spend by conditionPage 23
  21. Key figuresPage 24
  22. Brand certaintyPage 25
  23. Book of businessPage 26
  24. Future certaintyPage 27
  25. Looking aheadPage 28
  26. Decision supportPage 29
  27. Request the full studyPage 30
  28. Sources and definitionsPage 31
Contents03
Digbi HealthPublic sector health trust · Through the May 2025 outcomes report

04 · Certainty module 01

Market certainty
Organizations like this one have already validated Digbi at scale

A statewide public sector benefits trust covering roughly 10,000 employees across many member employers has run the program since May 2024, placed by Brown & Brown.

What the next pages prove

  • 01A multi employer trust, not a single site pilot
  • 02Consultant of record: Brown & Brown
  • 03Participation grew from 84 to 449 members

Pages in this module

  1. Client snapshot
Certainty module 0104
Digbi HealthPublic sector health trust · Through the May 2025 outcomes report

05 · Client snapshot

Ten thousand lives,
and a medication cliff ahead.

A public sector benefits trust covering roughly 10,000 employees, facing a pharmacy benefit change that ends branded GLP-1 coverage.

At a glance

Industry
Public sector benefits trust
Region
North Dakota
Population
~10,000 covered employees
Program launch
May 2024
Review cadence
Biannual business review
Participants
449 as of Q2 2025

The covered workforce

~10,000

covered employees across public sector employers

449

participants as of Q2 2025, up from 84

83 / 17

women to men among participants

14%

of participants are dependents

80%

of new enrollments come from email outreach

30% / 20%

at high genetic risk of weight gain and regain

Roughly ten thousand covered employees sit under a statewide public sector trust, drawn from school districts and public employers spread across North Dakota. There is no single worksite and no shared shift pattern, so every member has to be reached individually.

That is why email is the front door here rather than a benefits fair. Four in five new enrollments come from email outreach, and communications are capped at twice a month so the channel keeps working across a long program.

A public sector employee benefits trust employee at work in North Dakota

Population mix

Gender split

83:17

Dependents enrolled

14%

Email driven enrollment

80%

Email open rate

72%

Client snapshot05
Digbi HealthPublic sector health trust · Through the May 2025 outcomes report

06 · Certainty module 02

Scientific certainty
The approach is backed by measurable clinical outcomes

Precision biology, gut and genetic testing, applied to the metabolic and digestive conditions carrying the trust's influenceable spend.

What the next pages prove

  • 01Care directed by gut and DNA test results, not generic coaching
  • 02Designed to hold results as branded GLP-1 coverage ends

Pages in this module

  1. The challenge
  2. Why Digbi
Certainty module 0206
Digbi HealthPublic sector health trust · Through the May 2025 outcomes report

07 · The challenge

A pharmacy change
with a date on it.

Digbi members preparing a fresh meal at home

Where the pressure comes from

01

Comorbidity distribution puts mental health at 56%, insulin and cholesterol issues at 41%, digestive health at 38% and sleep issues at 38%.

02

The pharmacy benefit manager stops covering branded GLP-1 medications from October 2026, which forces an active transition for members already on therapy.

03

Genetic risk data shows 30% of members at high risk of weight gain and 20% at high risk of regain, which supports a preventive rather than reactive design.

04

The population is distributed across public sector and school employers, so outreach has to work by email rather than on site.

The challenge07
Digbi HealthPublic sector health trust · Through the May 2025 outcomes report

08 · Why Digbi

Works with medication,
and without it.

With branded GLP-1 coverage ending in October 2026, the program has to hold results for members on and off medication.

The differentiators the client cites

01

Evidence on GLP-1 side effects

A member survey on digestive symptoms among GLP-1 users showed how the program manages those symptoms, which drew a strong reaction from the trust's advisers.

02

Medication support end to end

Prior authorisation and pharmacy routing are handled for members who need them, rather than left with the benefits team.

03

AI coaching between sessions

An engagement layer gives members meal feedback between coaching sessions, with close to 80% positive feedback on that feature.

Medication transition

Prior authorisation and pharmacy routing are managed end to end.

Results either way

83% of members on medication lost weight, and 53% of those without it.

AI meal feedback

Close to 80% positive member feedback on the feature.

Why Digbi08
Digbi HealthPublic sector health trust · Through the May 2025 outcomes report

09 · Certainty module 03

Clinical certainty
Members are supported by a safe, accountable clinical model

Clinical movement is tracked per member each quarter and reported against the measures the trust already uses.

What the next pages prove

  • 0174% of active members lost weight
  • 0235% past the 5% clinically significant threshold
  • 0383% of members on GLP-1 medication lost weight

Pages in this module

  1. Risk concentration
  2. Health outcomes
  3. Behaviour change
Certainty module 0309
Digbi HealthPublic sector health trust · Through the May 2025 outcomes report

10 · Risk concentration

Where the risk
concentrates.

Comorbidity distribution across the population, from the May 2025 report. Mental health leads, followed by insulin and cholesterol issues.

Top comorbidities

Mental health

56% of the population

Insulin and cholesterol

41% of the population

Digestive health

38% of the population

Sleep issues

38% of the population

30%

High risk of weight gain

20%

High risk of regain

Oct 2026

Branded GLP-1 coverage ends

Source · Outcomes and impact report, May 2025

A Digbi member at home reviewing program results over a meal
Risk concentration10
Digbi HealthPublic sector health trust · Through the May 2025 outcomes report

11 · Health outcomes

Five quarters of engagement
above eighty eight percent.

Weight, engagement and medication cohort outcomes are all computed in the May 2025 report and reviewed with the trust each quarter.

Outcome status

Measured

Weight loss

More than 74% of active members lost weight, and 35% passed the 5% clinically significant threshold across 2024 and 2025.

Measured

Engagement

Engagement held above 88% for five consecutive quarters while participation grew from 84 to 449 members.

Measured

GLP-1 and non GLP-1 members

83% of members using GLP-1 medication lost weight. Among members not using medication, 53% still achieved meaningful loss.

Health outcomes11
Digbi HealthPublic sector health trust · Through the May 2025 outcomes report

12 · Behaviour change

Sustained change
in food choices.

Nutrient density scores track what members actually eat. Scores climbed into the 12 to 14 range associated with weight loss and gut health, and held there across the reporting period.

Nutrient density score trend

Clinical threshold 1210.512.2
20242025

The clinical threshold of 12 and above is associated with sustained weight loss and gut health improvement

10.5 → 12.2

Nutrient density score

Into the 12 to 14 range the report associates with lasting benefit.

74%+

Active members losing weight

Measured across active participants in 2024 and 2025.

35%

Past the 5% threshold

Clinically significant weight loss across the same window.

Source · Outcomes and impact report, May 2025, reported nutrient density score

Behaviour change12
Digbi HealthPublic sector health trust · Through the May 2025 outcomes report

13 · Certainty module 04

Operational certainty
The program has been implemented successfully across a dispersed workforce

Employees spread across many public sector employers and locations enrolled through trust wide campaigns, with no clinic visit required.

What the next pages prove

  • 01449 participants as of Q2 2025, up from 84
  • 02Engagement above 88% for five consecutive quarters
  • 0372% email open rate across 2025 campaigns

Pages in this module

  1. The program
  2. Participation curve
  3. Enrollment in detail
Certainty module 0413
Digbi HealthPublic sector health trust · Through the May 2025 outcomes report

14 · The program

What members
actually receive.

Enrollment runs on email outreach, then members log meals and work with a coach against nutrient density scoring.

Member journey

  • 01Email led enrollment, which drives 80% of new members
  • 02App based logging with nutrient density scored meal feedback
  • 03One to one coaching
  • 04Monthly clinical consults and prior authorisation management for members on medication
  • 05Communications capped at twice a month to avoid over contacting members
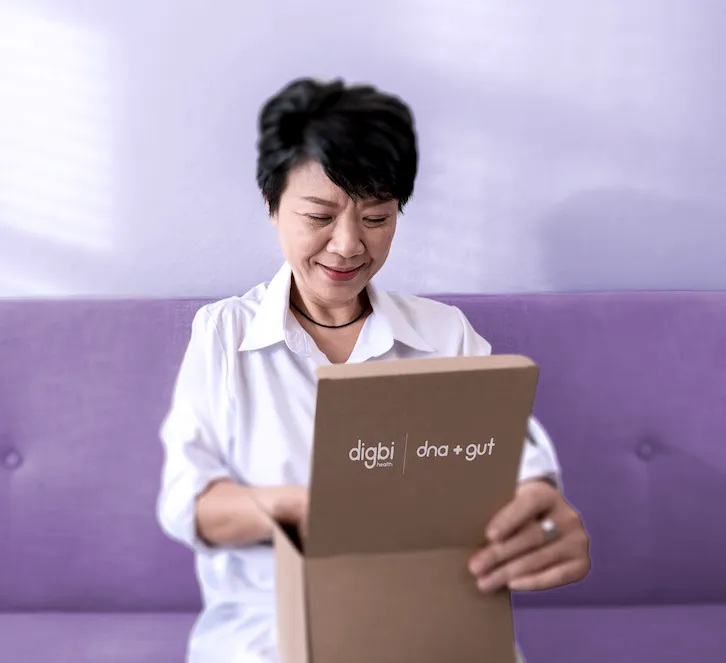
A Digbi member opening her DNA and gut test kit at home

Every member begins with a gut and genetic test, shipped to the door

The program14
Digbi HealthPublic sector health trust · Through the May 2025 outcomes report

15 · Participation curve

Participation grew from 84
to more than 440.

Documented participant counts at the two reported points. Engagement stayed above 88% across five consecutive quarters in the same window.

Active participants

84

Q1 2024

449

Q2 2025

Source · Outcomes and impact report, May 2025

Participation curve15
Digbi HealthPublic sector health trust · Through the May 2025 outcomes report

16 · Enrollment in detail

Month by month,
how the roster was built.

A direct pull from the member platform shows the steadiest enrollment curve of any account in this book. No single spike carried the program. New members arrived nearly every month from the May 2024 launch onward.

New enrollments by plan year

284

2024

434

2025

179

2026 ytd

Roster at a glance

900

member records matched on the covered roster

765

members currently on enrolled status

84

new members in June 2024, the launch month

687 / 114

employees to dependents, spouses and children

25 to 56

new members nearly every month through 2025

179

new members in 2026 through August, a partial year

Growth accelerated after the launch year. New enrollments rose from 284 in a partial 2024 to 434 across 2025, the only account in this book where year two beat year one.

The curve is unusually flat month to month, which is what sustained email outreach produces rather than a single open enrollment push.

This is the only population whose records separate spouses and children from the general dependent category, which makes family side outreach easier to target.

Source · Digbi member platform export, covered population records, May 2024 through August 2026.

Enrollment in detail16
Digbi HealthPublic sector health trust · Through the May 2025 outcomes report

17 · Certainty module 05

Product certainty
Members engage and sustain participation over time

Engagement holds quarter after quarter, and members describe the change in their own words.

What the next pages prove

  • 01Engagement above 88% across five straight quarters
  • 02Recorded member stories from this workforce

Pages in this module

  1. Member satisfaction
  2. Member testimonials
Certainty module 0517
Digbi HealthPublic sector health trust · Through the May 2025 outcomes report

18 · Member satisfaction

What members say
about the program.

Engagement and sentiment are reported alongside clinical outcomes, because a distributed public sector population is easy to lose between quarters.

88%+

Engagement rate

Held for five consecutive quarters while participation grew fivefold.

~80%

Positive feedback on AI meal feedback

Member response to the AI layer that works between coaching sessions.

72%

Email open rate in 2025

Up from 50% in 2024, with clicks up from 5% to 8.5%.

Energy and pain relief

Members report less back pain and more energy through the working day.

Blood pressure movement

Members describe lower readings alongside how they feel day to day.

Digestive relief

Acid reflux and gut symptoms are the change members notice first.

“I honestly feel like a new person. My back pain has almost completely disappeared, and I have far more energy through the day.”

“When I was diagnosed with diabetes I was overwhelmed. I started at 210 pounds and could not break past 171, until now.”

Member satisfaction18
Digbi HealthPublic sector health trust · Through the May 2025 outcomes report

19 · Member testimonials

Stories from the
Humans of Digbi.

Zina, a program participant

Zina

Public sector employee, 38 · North Dakota

Watch the video

“I have had gut issues since I was a kid. It was always my problem, and I had been searching for a program like this one.”

Once I started, the pain disappeared. I stopped waking up with stomach pain, my health improved and I felt happier.

The health report told me exactly where to go. What to eat, whether to lean on proteins or veggies, and which food sensitivities I had. I had no idea, I thought I was eating healthy.

I had never eaten fermented foods before. Now kimchi, plain yogurt and sauerkraut are part of my daily routine.

12 lb

lost, with gut pain resolved

Lifelong gut pain resolvedFood sensitivities identifiedFermented foods addedSleep improved

David, a program participant

David

Oil field worker and musician · Dickinson, North Dakota

Watch the video

“I went in for extra life insurance because we work in the oil field, and they told me I was a type 2 diabetic. I said there is no way.”

When I said I did not want to go on medication, they were totally fine with it. They said let us work on your nutrition instead.

It was really interesting to see what my body was actually doing, and then to have people with real educations read it and make micro changes from there.

Getting facts about yourself can never harm you. They do not push medicine, they push health.

16 lb

lost, with type 2 diabetes addressed without medication

Type 2 diabetes addressed without medicationNutrition first planContinuous glucose insights
Member testimonials19
Digbi HealthPublic sector health trust · Through the May 2025 outcomes report

20 · Certainty module 06

Financial certainty
The program delivers measurable business value

Spend is read straight from the claims file, including where it concentrates, how it trends and which conditions carry it.

What the next pages prove

  • 01Claims spend reported per plan year for the trust
  • 02High cost claimant concentration reported per plan year
  • 03Condition level spend mapped to the program's clinical focus

Pages in this module

  1. Claims and cost concentration
  2. Claims trend by plan year
  3. Claim spend by condition
  4. Key figures
Certainty module 0620
Digbi HealthPublic sector health trust · Through the May 2025 outcomes report

21 · Claims and cost concentration

Where the claim dollars
actually sit.

Claims records were pulled member by member across the covered population and summed by plan year. This is the largest claims base in the book, and the most concentrated spend pattern of the three public and private employers reviewed here.

$34.7M

total claim cost across all plan years on file

3,729

members with claim cost recorded

1,401

high cost claimants at the $2,000 threshold

95.4%

of all claim spend sits with those 1,401 members

Members by lifetime claim cost

Under $2,0002328 · 62%
$2,000 to $10,000882 · 24%
$10,000 to $50,000428 · 11%
$50,000 and above91 · 2%

Lifetime claim cost per member, all plan years summed. Six in ten claimants stay under the high cost threshold, while the 519 members above $10,000 carry the bulk of the trust's exposure.

37.6%

of claimants are high cost

95.4%

of dollars they account for

2.5x

spend concentration versus their share of members

Source · Digbi claims pull, covered population, plan years 2022 through 2025. High cost claimant defined as $2,000 or more in claims, the Digbi standard threshold.

Claims and cost concentration21
Digbi HealthPublic sector health trust · Through the May 2025 outcomes report

22 · Claims trend by plan year

Cost per member,
before and after launch.

Claim cost per member per year for the whole claims population, shown next to the same population with high cost claimants removed.

Cost per member per year

2025 against the 2023 baseline

42.2%

$1,011

$627

$2,580

$455

$7,648

$511

$4,418

$544

2022

2023

2024

2025

All claimantsExcluding high cost claimants

Cost per member per year spiked to $7,648 in 2024 and reverted to $4,418 in 2025. Strip the high cost claimants out and the rest of the population sits between $455 and $627 across four years. Population level swings here are almost entirely a high cost cohort story.

High cost claimants, share of members against share of spend

11.1%

43.4%

18.8%

84.3%

24.3%

94.6%

26.9%

90.5%

2022

2023

2024

2025

Share of claimantsShare of claim spend

The high cost share of claimants has climbed every year on file, from 11.1% in 2022 to 26.9% in 2025, and their share of spend has held above ninety percent since the program launched. A statewide trust cannot move its trend without reaching this cohort.

Source · Digbi claims pull, covered population, plan years 2022 through 2025. High cost claimant defined as $2,000 or more in claims, the Digbi standard threshold.

Claims trend by plan year22
Digbi HealthPublic sector health trust · Through the May 2025 outcomes report

23 · Claim spend by condition

Which conditions carry
the cost.

Claim cost ranked by the conditions carried by the members generating it, with the number of members behind each line.

Claim cost by condition, all plan years

Hyperlipidemia$21.60M
Gastrointestinal disorders$20.60M
Gastrointestinal$19.10M
Gastroesophageal$17.00M
Coronary artery disease$14.70M
Hypertension$13.80M
Malabsorption syndromes$9.10M

Claim cost · members

Each member's full claim cost is counted against every condition they carry, so these totals overlap rather than add up. Read them as a ranking of which conditions sit inside the highest cost members. Lipid and digestive disease lead by a wide margin across this population.

Source · Digbi claims pull, covered population, plan years 2022 through 2025. High cost claimant defined as $2,000 or more in claims, the Digbi standard threshold.

Claim spend by condition23
Digbi HealthPublic sector health trust · Through the May 2025 outcomes report

24 · Key figures

GI outcomes, savings,
and population health.

88%+

engagement rate held for five consecutive quarters

2024 through 2025 · Outcomes and impact report, May 2025

84 → 449

participants, a fivefold increase

Q1 2024 through Q2 2025 · Outcomes and impact report, May 2025

74%+

of active members lost weight

2024 through 2025 · Outcomes and impact report, May 2025

35%

of active members passed the 5% weight loss threshold

2024 through 2025 · Outcomes and impact report, May 2025

10.5 → 12.2

nutrient density score, into the 12 to 14 range

2024 through 2025 · Outcomes and impact report, May 2025

72% / 8.5%

email open and click rates, up from 50% and 5%

2025 versus 2024 · Outcomes and impact report, May 2025

284 → 434

new enrollments, year two ahead of the launch year

2024 through 2025 · Digbi member platform export, August 2026

The savings build for the trust is driven by medication spend. Avoided GLP-1 spend across 57 members and compounded rather than branded fulfilment across 153 members account for the majority of the modelled figure, alongside members reaching a healthy body mass index.

Key figures24
Digbi HealthPublic sector health trust · Through the May 2025 outcomes report

25 · Certainty module 07

Brand certainty
Digbi is built for long-term partnership

The same model runs across manufacturing, pipeline and professional services books of business.

What the next pages prove

  • 01A book of business, not a single account

Pages in this module

  1. Book of business
Certainty module 0725
Digbi HealthPublic sector health trust · Through the May 2025 outcomes report

26 · Book of business

What Digbi has delivered
for comparable employers.

Context from other Digbi employer clients, not this client. Shown so a reader can see where a mature program tends to land.

Claims cost per enrolled member

Savings over four years

$18,500/member

$9,320

$9,320

$7,035

$10,465

$6,310

$12,497

$5,403

$14,576

2021

2022

2023

2024

On DigbiNot on Digbi

Over four years the claims cost per enrolled member fell from $9,320 to $5,403, while the matched group that never enrolled rose to $14,576. The gap covers diabetes, metabolic syndrome, digestive conditions and GLP-1 medication spend.

42%

Reduction in claims cost per enrolled member over four years

11.6 lbs

Average weight loss at six months, blue collar employer cohort

74%

Of engaged members reduced blood pressure, blue collar employer cohort

Source · Digbi Health multi employer claims analysis 2021 to 2024, and the national food distributor case study, 2023. Other clients, not this one.

Book of business26
Digbi HealthPublic sector health trust · Through the May 2025 outcomes report

27 · Certainty module 08

Future certainty
Digbi continues to expand value for the population

What the next plan year adds for the trust as branded GLP-1 coverage ends and medication support moves in house.

What the next pages prove

  • 01Self pay GLP-1 clinical support added January 2026

Pages in this module

  1. Looking ahead
Certainty module 0827
Digbi HealthPublic sector health trust · Through the May 2025 outcomes report

28 · Looking ahead

The plan for
the next plan year.

The plan through 2026 is shaped by a pharmacy benefit change with a date on it, and by the segments the program has not reached yet.

2026 priorities

01

Manage the October 2026 change

Branded GLP-1 coverage ends, so members on therapy need a managed transition and clear communications.

02

Hold results without medication

53% of members not using medication still achieved meaningful weight loss, and that cohort grows from October.

03

Reach men and dependents

Men are 17% of participants and dependents 14%, both below their share of the covered population.

04

Extend the engagement layer

Fitness integration and multilingual voice support widen who the program can hold onto.

Looking ahead28
Digbi HealthPublic sector health trust · Through the May 2025 outcomes report

29 · Certainty module 09

Decision support
The internal team has everything needed to build a clear, defensible case for Digbi

Everything needed to carry this internally: the underlying figures, their sources and a route to the full study.

What the next pages prove

  • 01Every figure carries a named source

Pages in this module

  1. Request the full study
  2. Sources and definitions
Certainty module 0929
Digbi HealthPublic sector health trust · Through the May 2025 outcomes report

30 · Request the full study

Want the full data pack
and the savings model?

Share your details and the Digbi team will send the complete study, including the underlying analysis and the enrollment model.

Or reach us directly

partner@digbihealth.com

digbihealth.com/meet

Request the full study30
Digbi HealthPublic sector health trust · Through the May 2025 outcomes report

31 · Sources and definitions

Where each figure
comes from.

  1. 01

    Outcomes and savings figures: outcomes and impact report, May 2025, Digbi Health internal. This is the most recent report located.

  2. 02

    Comorbidity and genetic risk figures: same report.

  3. 03

    Engagement and email performance: same report, 2024 and 2025 comparison.

  4. 04

    Open methodology question raised by the client's adviser: claims data does not include lab results, only which tests were performed.

Sources and definitions31

Talk to the team

Have questions? Our Enterprise team wants to hear from you.

Whether you are evaluating a precision nutrition program for a covered population or want to understand the methodology behind these case studies, we are happy to walk through it.